
Introduction
During test execution, the ATS Monitoring service allows you to collect various statistical information about:
- State of one or more physical hosts. This includes the usage of CPU, memory, virtual memory, network activity, etc
- State of one or more system processes. Currently, this means the CPU and memory usage
- Users activity. When running some kind of performance test, we usually simulate the activity of many simultaneous users. We are able to show how many users are running one or another action(step) at any given moment
- It is possible to write your own monitor which can be easily plugged into the current monitoring system. This way you can see some custom information, for example, this could be the number of "running jobs" or the "number of file transfers" on the tested server
It is generally not a good practice to monitor one host twice, e.g. monitoring one host via two agents, deployed on the same host.
This is once, a unnecessary repetition of information and second, ATS has problems displaying properly the data, since it is expected that for monitoring, there is one ATS Agent per host.
Using the Monitoring service
Here is a quick example for using the monitoring service in a test:
import com.axway.ats.monitoring.SystemMonitor;

// make an instance of the system monitoring class
SystemMonitor systemMonitor = new SystemMonitor();

// schedule monitoring of some physical host
// no activity will happen on the Agent side yet
systemMonitor.scheduleSystemMonitoring( SERVER_IP,
     new String[]{  SystemMonitor.MONITOR_CPU.ALL,
                    SystemMonitor.MONITOR_IO.ALL,
                    SystemMonitor.MONITOR_MEMORY.ALL,
                    SystemMonitor.MONITOR_VIRTUAL_MEMORY.ALL,
                    SystemMonitor.MONITOR_NETWORK_INTERFACES.ALL } );

// start the monitoring process
// in this example we will be collecting new data every 5 seconds,
systemMonitor.startMonitoring( 5 );

// in reality the test steps come here
// in our example - we do nothing for 5 minutes
Thread.sleep( 5 * 60 * 1000 );

// test is over, so stop the monitoring process
systemMonitor.stopMonitoring();
The result as seen in Test Explorer
And here is some example of what you might get:
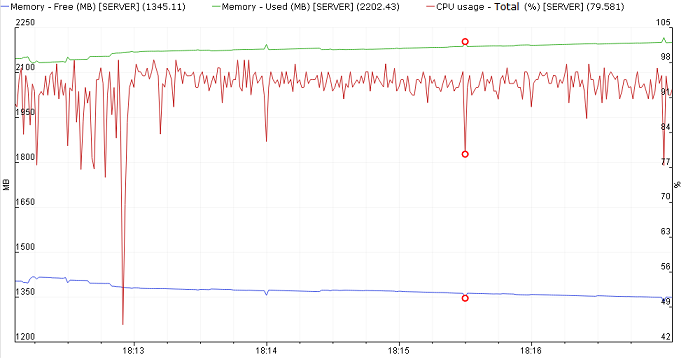
Here you can see the change in the amount of free and used memory as well as the CPU usage percentage
Starting the monitoring process
As you can see in the example code above, all you need to do is to call the startMonitoring method.
This method accepts as a first argument the collectInterval or pollInterval which is the number of seconds between polling for new data.
Stopping the monitoring process
All you need to do is to call the stopMonitoring method.
Note that after stop the SystemMonitor instance could not be reused and a new instance should be created for the next monitoring session.
Using the System monitoring agent
Here you can find the details.
Using the User activity monitoring agent
Here you can find the details.
How to call start and stop
Idle time before and after the test execution
It is usually wise to see what the system state is before the test is started and after the test is over.
That is why recommend putting some idle time just after calling the startMonitoring method and again just before calling the stopMonitoring method. This can be easily done using the Thread.sleep() method
The right place to call start and stop
It does not make sense to call the SystemMonitor methods in each scenario - there will be not needed code duplication. If using TestNG, the right place should be methods annotated with @BeforeMethod and @AfterMethod annotations
Example
Having in mind both notes above, here is how the start and stop code should look like
import org.testng.annotations.AfterMethod;
import org.testng.annotations.BeforeMethod;
import com.axway.ats.monitoring.SystemMonitor;

private SystemMonitor systemMonitor = null;

@BeforeMethod
public void beforeTest() throws Exception {

    systemMonitor = new SystemMonitor(); // make an instance of the system monitoring class
    // schedule monitoring of some physical host
    // no activity will happen on the Agent side yet
    systemMonitor.scheduleSystemMonitoring( SERVER_IP,
        new String[]{ SystemMonitor.MONITOR_CPU.ALL,
            SystemMonitor.MONITOR_IO.ALL,
            SystemMonitor.MONITOR_MEMORY.ALL,
            SystemMonitor.MONITOR_VIRTUAL_MEMORY.ALL,
            SystemMonitor.MONITOR_NETWORK_INTERFACES.ALL } );

    // start the monitoring process
    // in this example we will be collecting new data every 5 seconds,
    systemMonitor.startMonitoring( 5 );

    // the monitoring is started
    // here we could delay the test start, so meanwhile we will record the system state BEFORE the test impact
    Thread.sleep( 20 * 1000 );
}

@AfterMethod
public void afterTest() throws Exception {

    // the test is over
    // here we could delay the stop of monitoring, so meanwhile we will record the system state AFTER the test impact
    Thread.sleep( 20 * 1000 );

    // test is over, so stop the monitoring process
    if (systemMonitor != null) {
        systemMonitor.stopMonitoring();
    }
}
Performance considerations
Currently, no performance issues are known when using the ATS monitoring service even with some intensive polling interval.
However, we recommend that you wisely choose the polling interval according to the test duration. For example, if a test takes 5 days to complete, polling on each second will produce 432 000 values for each statistic and if you specify 20 or 30 different types of statistics you will get a very large amount of data going to the logging database.
Combining this with potentially extensive logging (via test messages, also going to the ATS DB) you may hit logging overflow. For more details, you may refer to this page.
Back to parent page
Go to Table of Contents