
Introduction
Here is the list of supported statistics you can collect on a host:
- System - load average for the last 1min, 5min, and 15 min. This applies for UNIX OSes only, i.e. not for Windows
- CPU - the percentage of the CPU load while running kernel, user, and total code. As well as waiting for I/O operations to happen
- Network traffic - number of received (RX) and transmitted (TX) bytes for each network interface
- Memory - used, free, actual used and actual free. The actual used and actual free apply on UNIX-based systems only and take into consideration the UNIX buffered and cached memory
- Virtual memory - total, used, free, pages in and pages out
- Input/Output - read and write bytes on the file system
- Netstat command statistics
- TCP statistics
- Any application statistics
- CPU - time spent running kernel, user, and total code
- Memory - used memory and memory page faults
- Java application statistics
- CPU
- Memory - detailed heap and others
- Number of threads
- Number of loaded classes
- Custom statistics
Usage
Once you have made an instance of the SystemMonitor class, all you need to do is to use the right methods starting with schedule...
System monitoring
The scheduleSystemMonitoring() method allows monitoring the state of a physical host.
systemMonitor.scheduleSystemMonitoring( <AGENT ADDRESS>,
      new String[]{ SystemMonitor.MONITOR_CPU.ALL,
                    SystemMonitor.MONITOR_IO.ALL,
                    SystemMonitor.MONITOR_MEMORY.ALL,
                    SystemMonitor.MONITOR_VIRTUAL_MEMORY.ALL,
                    SystemMonitor.MONITOR_NETWORK_INTERFACES.ALL } );
It accepts the following parameters:
- AGENT ADDRESS - the Agent address running on the monitored host
- Array with monitor types - this defines what kind of statistics to collect. Use the various SystemMonitor.MONITOR _ * constants
Note that currently Netstat and TCP connection state statistics are not supported on AIX.
JVM monitoring
The scheduleJvmMonitoring() method allows monitoring a Java Virtual Machine(JVM) process.
This gives a much deeper look compared to the regular process monitoring. For example, the regular process monitoring will give you info about the total used memory, but the JVM monitoring will break this further into different areas of Heap memory, Permanent generation, and Code cache. You can also see how many regular and daemon threads are running.
The list of supported JVM statistics is likely to grow in the future per customer requests.
systemMonitor.scheduleJvmMonitoring(
      <AGENT ADDRESS>,
      <JMX/JVM MONITORING PORT>,
      new String[]{     SystemMonitor.MONITOR_JVM.MEMORY_HEAP,
                        SystemMonitor.MONITOR_JVM.MEMORY_HEAP_YOUNG_GENERATION_EDEN,
                        SystemMonitor.MONITOR_JVM.MEMORY_HEAP_YOUNG_GENERATION_SURVIVOR,
                        SystemMonitor.MONITOR_JVM.MEMORY_HEAP_OLD_GENERATION,
                        SystemMonitor.MONITOR_JVM.MEMORY_PERMANENT_GENERATION,
                        SystemMonitor.MONITOR_JVM.MEMORY_CODE_CACHE,

                        SystemMonitor.MONITOR_JVM.CPU_USAGE,

                        SystemMonitor.MONITOR_JVM.THREADS_COUNT,
                        SystemMonitor.MONITOR_JVM.THREADS_DAEMON_COUNT,

                        SystemMonitor.MONITOR_JVM.CLASSES_COUNT } );
It accepts the following parameters:
- AGENT ADDRESS - the Agent address running on the monitored host
JVM MONITORING PORT - We must be able to connect to your JVM, so can capture the needed info. Here you specify the port for this (JMX) internal connection.
JVM monitoring port
Use the following environment parameters in order to open your JVM application for remote connections:
-Dcom.sun.management.jmxremote.port=1234
-Dcom.sun.management.jmxremote.authenticate=false
-Dcom.sun.management.jmxremote.ssl=falseIn this example the important part is the port, you can specify any available port number
- Array with monitor types - this defines what kind of statistics to collect. Use the various SystemMonitor.MONITOR_JVM _ * constants
Custom JVM monitoring
The scheduleCustomJvmMonitoring() method allows monitoring a custom Java Virtual Machine(JVM) process.
systemMonitor.scheduleCustomJvmMonitoring( <AGENT ADDRESS>,
                                           <JMX_PORT>,
                                           <ALIAS>,
                                           <MBEAN_NAME>,
                                           <MBEAN_METRIC>,
                                           "ATTRIBUTE" );
To have a custom monitoring data about some JVM process you need to know the MBean name and its attribute. If you do not know them you can use getJvmMbeans() method in SystemOperations class. The other option is by using the JConsole application.
This is simply an example from the getJvmMbeans() method output:
MBean name: org.apache.camel:context=Advanced Routing Camel Context,name=DefaultExecutorServiceManager,type=services


MBean name: java.lang:type=Threading
   PeakThreadCount | int
   DaemonThreadCount | int
   ThreadCount | int
   TotalStartedThreadCount | long
   CurrentThreadCpuTime | long
   CurrentThreadUserTime | long


MBean name: org.apache.camel:context=Advanced Routing Camel Context-1,name=EndpointRegistry,type=services
   Size | java.lang.Integer
   MaximumCacheSize | java.lang.Integer
Process monitoring
The scheduleProcessMonitoring() method allows monitoring the state of a system process, commonly this the process that is running the Application Under Test.
Here is an example of usage:
systemMonitor.scheduleProcessMonitoring( <AGENT ADDRESS>,
                                         ".*chrome.*",
                                         "BROWSER",
                                         new String[]{
                                              SystemMonitor.MONITOR_PROCESS_CPU.ALL,
                                              SystemMonitor.MONITOR_PROCESS_MEMORY.ALL
                                         } );
It accepts the following parameters:
- AGENT ADDRESS - the Agent address running on the monitored host
- Process pattern - some string that identifies the system process. We try to match this string against the start command of the system process
If no process is matched - a warning is registered in the log file
If more than one processes are matched - we append indexes at the end of the process alias
In this example, we are looking for system processes which have in their start command the token "chrome" - Process alias - a user-friendly name to display when showing the statistic on the Test Explorer
In this example, the statistic will be presented as a BROWSER - Process username - use this parameter to specify that the monitored process must be started by a particular user. This is an optional parameter. By default, we search for processes from all users
- Array with monitor types - defines what kind of statistics to collect. Use the various SystemMonitor. MONITOR_PROCESS _ * constants
Combining processes as one virtual process
Imagine you want to get a picture of the performance of Application Under Test which runs as more than one actual processes
The scheduleChildProcessMonitoring() method has the same input argument as the scheduleProcessMonitoring() plus one more argument. This argument specifies the name of some virtual parent process.
Using this method you can specify that some monitored process belongs to a parent process and you will see how much resources( for example CPU) are used by all of the separate processes as well as by the virtual parent process
Providing parameters to a monitor
Sometimes a monitor may need to get some input arguments so it can work properly. Imagine you have your own custom monitor and it collects data from a database, but you need to somehow pass the database connection parameters. Here is some example of such case:
// create a map with all needed parameters
Map<String, String> statisticParameters = new HashMap<String, String>();
statisticParameters.put( "dbHost", "127.0.0.1" );
statisticParameters.put( "dbPort", "5555" );
statisticParameters.put( "dbUser", "MyUser" );
statisticParameters.put( "dbPassword", "MyPassword" );

// call your own monitor and provide the needed parameters
systemMonitor.scheduleMonitoring( <MONITORING SERVICE IP AND PORT>, "My Custom DB Statistic", statisticParameters );
Monitoring more than one host
You can freely monitor as many hosts as needed. You can also monitor as many processes on each host as needed.
Reviewing the collected data
The collected data is available at Test Explorer UI. Here is an example:
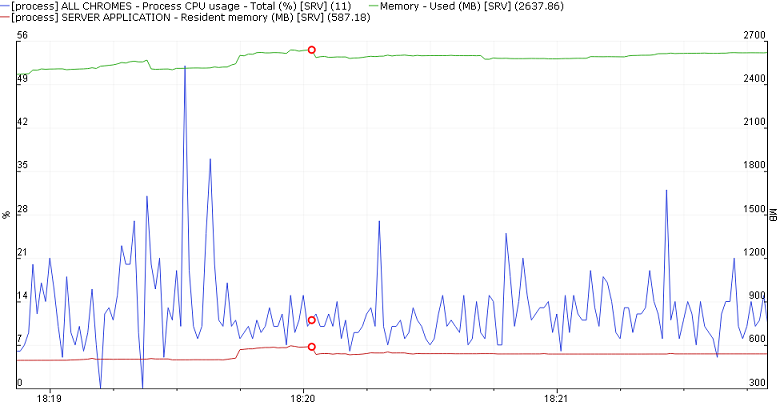
This example shows:
- Memory used by the whole system - the green line
- Memory used by the Application Under Test - the red line
- CPU usage by all chrome instances. We see them here as one single application - the blue line
Customizing the data collection
Imagine you need to monitor something which is specific to your testing environment. Of course, ATS does not know about it and does not provide it automatically, but you can attach your own code to the Monitoring Service and collect your own statistics and display them in the regular way.
Here are the details
Back to parent page
Go to Table of Contents